
UFC fight predictor 1-- scraping and exploratory analysis
Recently, I become a fan of Weili Zhang, the new UFC Women’s Strawweight Champion. She is a truly dedicated, confident and humble Chinese mixed martial artist. While looking into MMA, I am well aware of “MMA math does not work.” That is if A beats B and B beats C, we can not conclude chances are that A will beat C. Then the question is how to predict the result of a coming MMA fight.
If MMA math does not work, how about MMA machine learning?
Scrape bout and fighter data
To build a machine learning model, the first step is to collect data. Luckily, UFC stats has recorded the match statistics since UFC 1: The Beginning. There are also data about each fighter, such as height, date of birth and reach. The website is well organized and I decided to scrape the data by myself. This is the first time that I attempt to scrape from the internet. And I am surprised that this is much easier than I thought.
I just studied the basic scrapy tutorial and used Chrome to get 5000+ bout data and 1700+ fighter information. The most intimidating part in scraping is to parse the webpage either by css or xpath. I do not have any experience/knowledge of building html. But Google Chrome saves me! Just select the element on the webpage, right click, choose ‘inspect’, Chrome DevTools shows the css class/label.
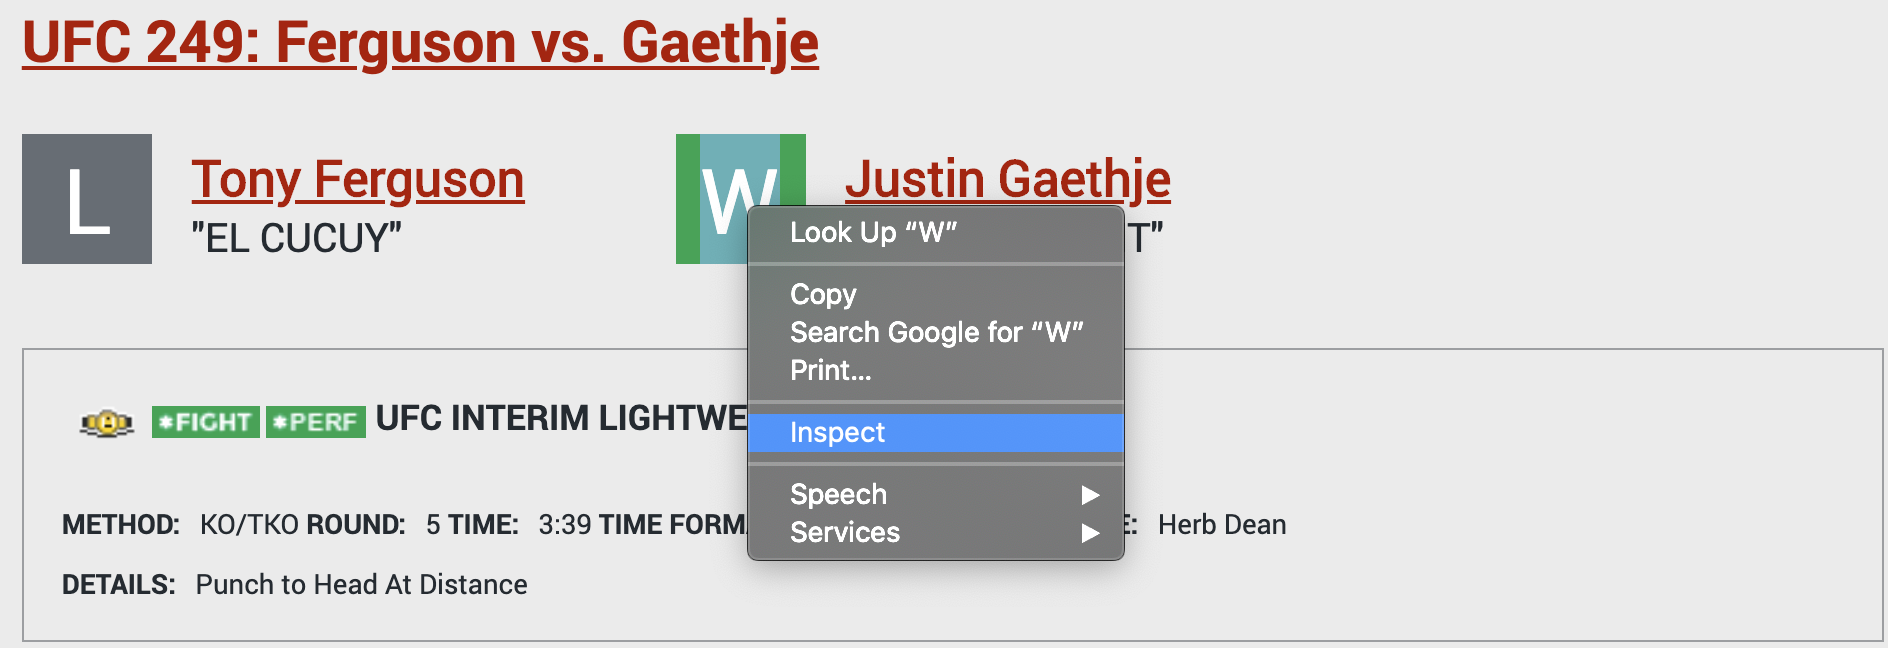
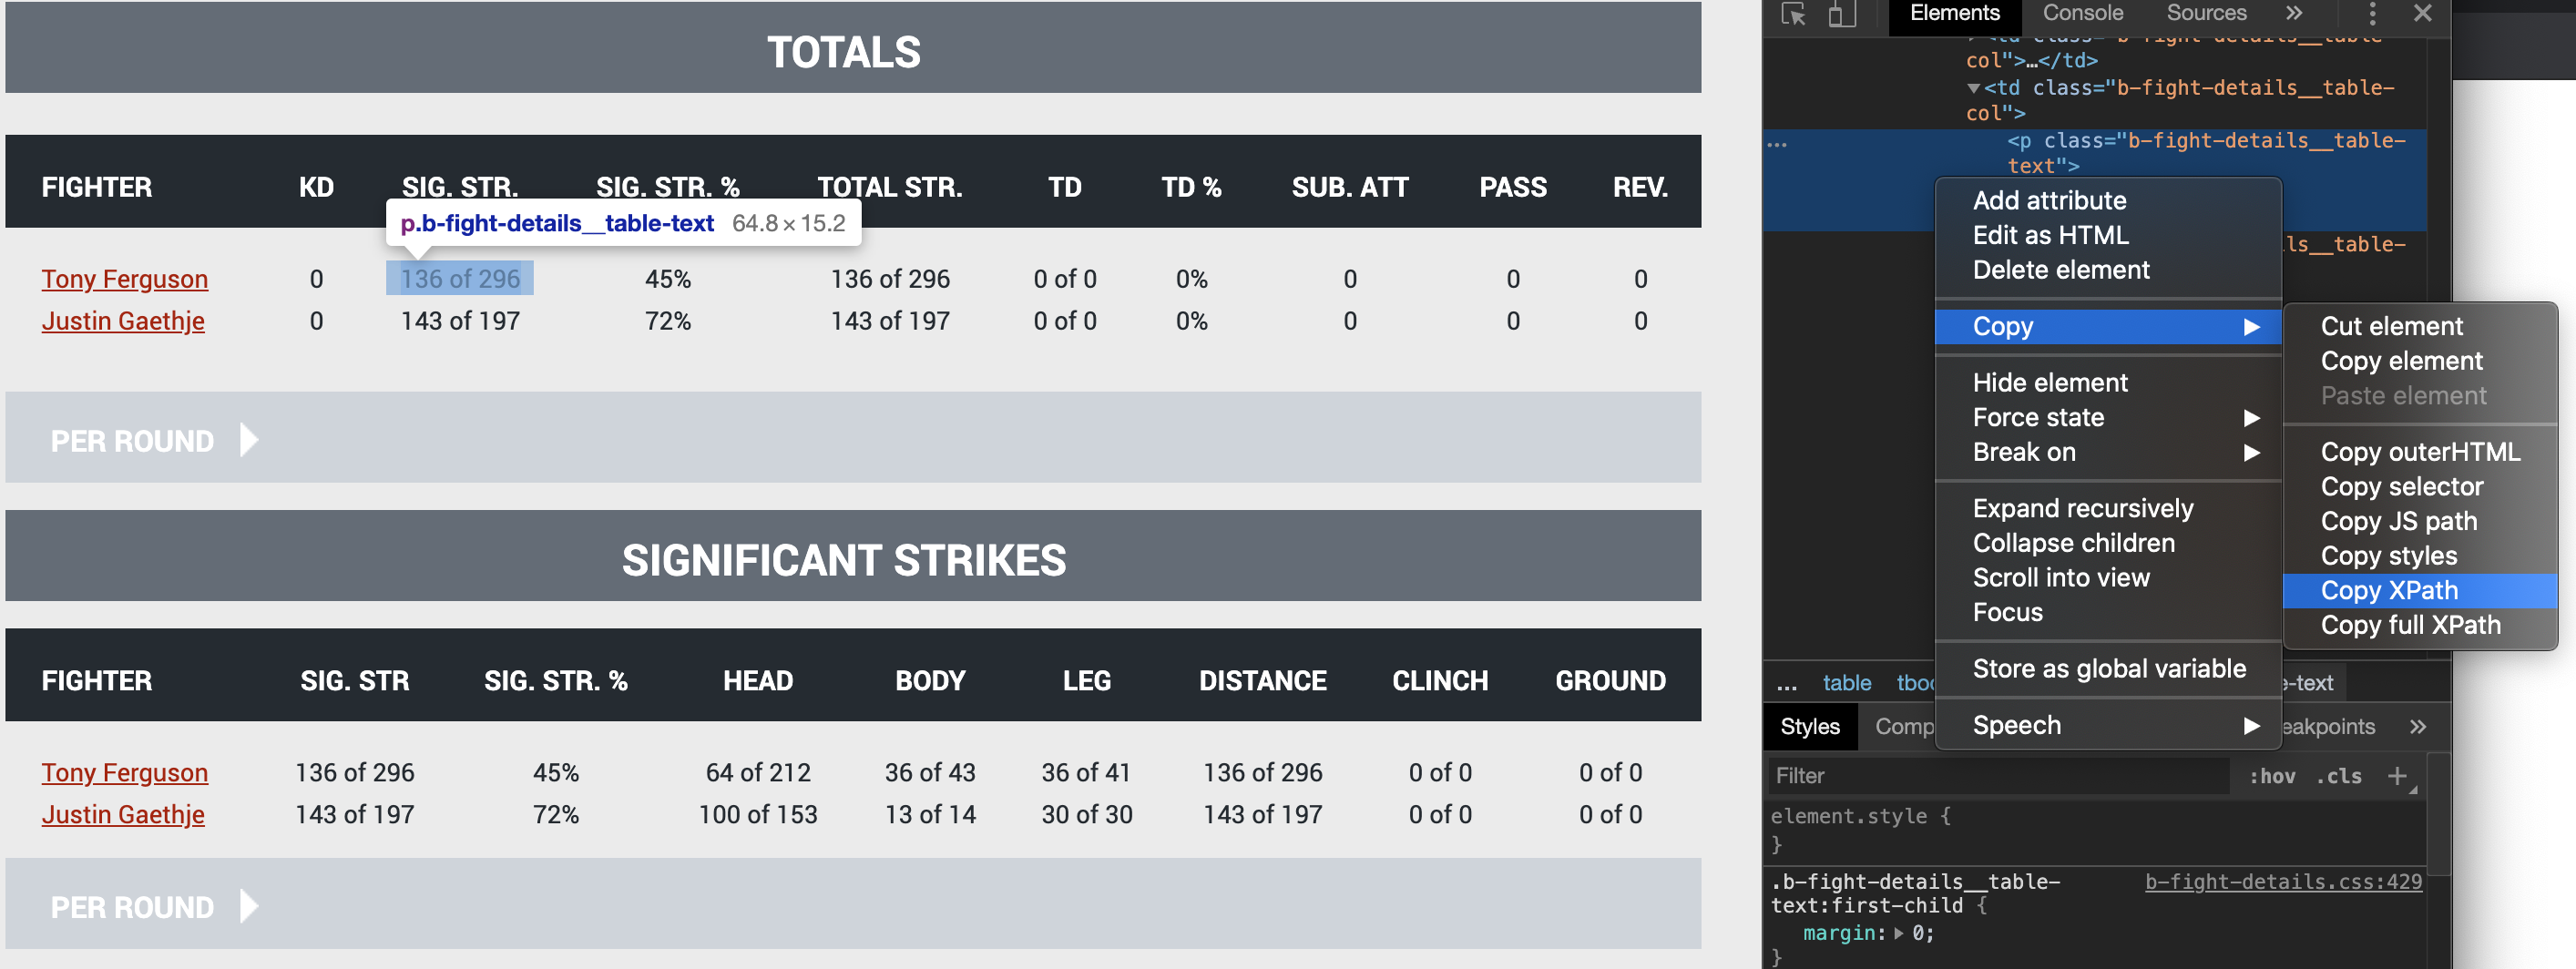
Sometimes, we need to use Xpath giving a more accurate location. Then just right lick the element, choose ‘Copy’-> ‘Copy Xpath’. It is that convenient.
I am going to share all the scrapy scripts and the tidied data on Github.
Data wrangling
The raw data is extremely noisy. In the fighter data, there are 4 pairs of fighters have the same name. I looked into the details and decided to delete 4 fighters since they have none or at most 1 fight, which does not help build the predictor. Also, the methods of decision is more than ‘KO/TKO’, ‘Submission’ and ‘Decision’. I created an ‘Other’ category to put all other methods into it. Other data tidying work includes extracting the numbers from ‘136 of 296’ (number of significant strike out of total number of strike), changing the string to datetime and creating new variables, etc.
Exploratory analysis
Now we have about 5000 fights data, we are able to answer some general questions via visualization. I the following, I inspect four questions.
1. Number of fights per year and win method proporation
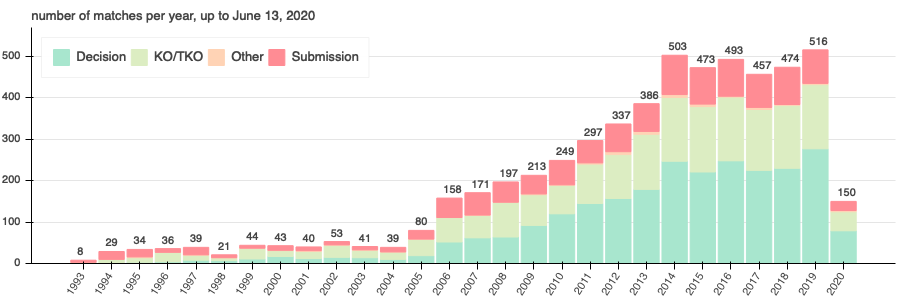
From the above figure, we saw that UFC developed the fastest during 2005 - 2014. In the recent six years, there are about 500 bouts per year. However, in 2020, to June 13, there are only 150 bouts. The pandemic forced the UFC to cease in April and the government does allow the foreign fighters to enter the US. Besides, about half of the matches are won by decision, which means they last 3 or 5 rounds.
2. Impact of reach-height-ratio on the results
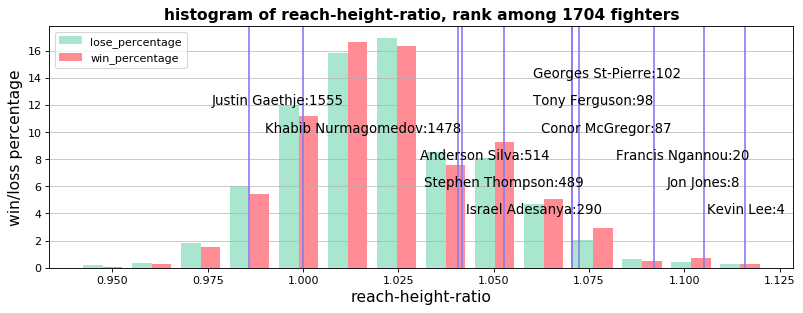
Definitely, a higher reach-height-ratio is a big advantage in striking games. And it is well known that most of the elite MMA athletes have a relatively large reach-height-ratio. Here, I plot a histogram of reach-height-ratio, where the y-axis is the percentage of the number of wins/losses in a specific reach-height-ratio bin. The red(win) bar plot has a heavier right tail than the green(lose) bar plot. This is evidence that higher reach-height-ratio results in a higher probability of winning.
I also ranked the fighters by their reach-height-ratio. Among all the 1704 UFC fighters, the GOAT Jon Jones ranks 8th. He is so gifted that I feel like he does not fully utilize it and lacks of training. On the contrary, Justin Gaethje ranks 1555/1704. Oh, these short arms defeated Tony Ferguson’s iron chin.
3. Age factor in win/loss
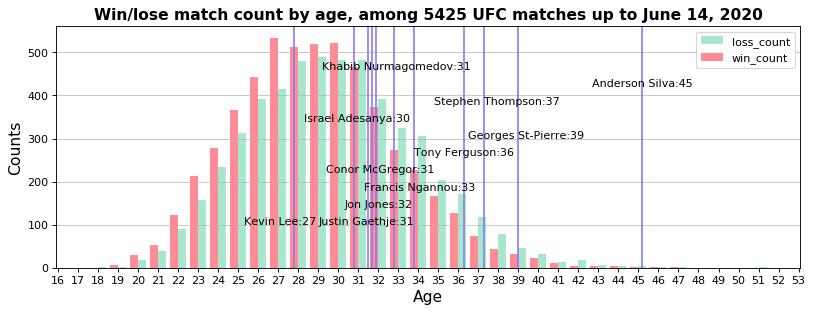
Some fans are arguing that the failure of Tony in UFC 249 is due to his age. He is not in his prime. At first, I doubt this. After I get the above plot, I am convinced that age is a huge element in determining the result. The histogram of age looks like a normal distribution, but the red/win histogram shifts to the left (younger age) compared with the lose/green histogram.
Besides Tony, I love Stephen ‘Wonderboy’ Thompson the most. Tony has an interim belt but Wonderboy still does have a gold belt. I am worried about his health if he continues to fight at age 37 with a such small chance to win.
4. striking and ground statistics
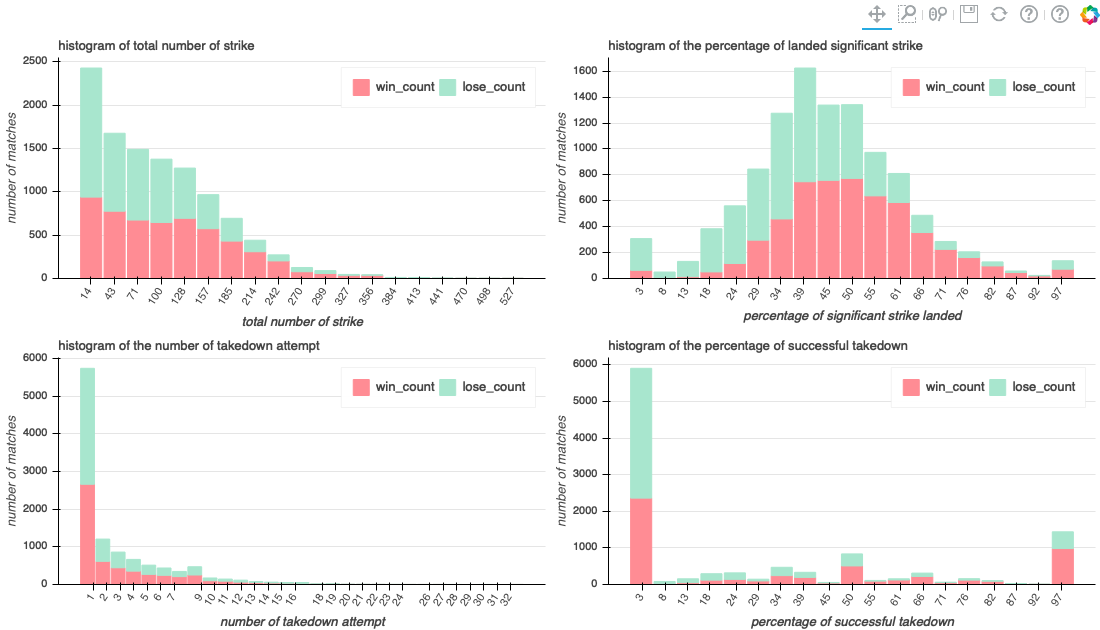
The result of a fight is largely determined by the number of significant strikes and takedown success. In the above four histogram plots, only the significant strike percentage has an obvious difference between a win and loss. The shape of the right-bottom plot is also interesting. It seems that most of the players have extremely high or low-level grappling because most of the weight locates near 0% or 100%.
Next step
About 5000 records can not support a very large neural network model. But I am thinking about each player’s career as a sequence of events so that we can apply some sequential modeling, RNN or transformer. I am also considering the random forest algorithm since the number of features and sample size is relatively small. It might favor a traditional prediction model instead of a deep learning model.